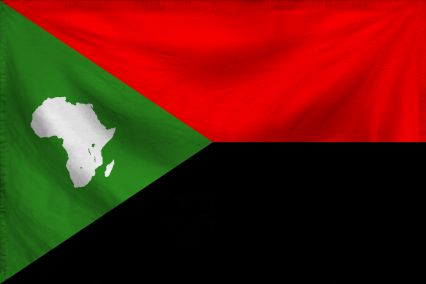
The Free Land of The Sub-Saharan Federation
Prosperity For All
Region: Geopolity
Quicksearch Query: The Sub-Saharan Federation
|
Quicksearch: | |
NS Economy Mobile Home |
Regions Search |
The Sub-Saharan Federation NS Page |
|
| GDP Leaders | Export Leaders | Interesting Places BIG Populations | Most Worked | | Militaristic States | Police States | |

Prosperity For All
Region: Geopolity
Quicksearch Query: The Sub-Saharan Federation
| The Sub-Saharan Federation Domestic Statistics | |||
|---|---|---|---|
| Government Category: | Free Land | ||
| Government Priority: | Commerce | ||
| Economic Rating: | Frightening | ||
| Civil Rights Rating: | Frightening | ||
| Political Freedoms: | Corrupted | ||
| Income Tax Rate: | 96% | ||
| Consumer Confidence Rate: | 102% | ||
| Worker Enthusiasm Rate: | 103% | ||
| Major Industry: | Information Technology | ||
| National Animal: | hippopotamus | ||
| The Sub-Saharan Federation Demographics | |||
| Total Population: | 3,606,000,000 | ||
| Criminals: | 233,210,419 | ||
| Elderly, Disabled, & Retirees: | 195,351,141 | ||
| Military & Reserves: ? | 0 | ||
| Students and Youth: | 888,518,400 | ||
| Unemployed but Able: | 428,136,642 | ||
| Working Class: | 1,860,783,397 | ||
| The Sub-Saharan Federation Government Budget Details | |||
| Government Budget: | $123,049,112,911,845.78 | ||
| Government Expenditures: | $104,591,745,975,068.91 | ||
| Goverment Waste: | $18,457,366,936,776.88 | ||
| Goverment Efficiency: | 85% | ||
| The Sub-Saharan Federation Government Spending Breakdown: | |||
| Administration: | $17,780,596,815,761.71 | 17% | |
| Social Welfare: | $11,505,092,057,257.58 | 11% | |
| Healthcare: | $11,505,092,057,257.58 | 11% | |
| Education: | $18,826,514,275,512.40 | 18% | |
| Religion & Spirituality: | $0.00 | 0% | |
| Defense: | $0.00 | 0% | |
| Law & Order: | $4,183,669,839,002.76 | 4% | |
| Commerce: | $24,056,101,574,265.85 | 23% | |
| Public Transport: | $3,137,752,379,252.07 | 3% | |
| The Environment: | $7,321,422,218,254.82 | 7% | |
| Social Equality: | $5,229,587,298,753.45 | 5% | |
| The Sub-Saharan FederationWhite Market Economic Statistics ? | |||
| Gross Domestic Product: | $82,589,200,000,000.00 | ||
| GDP Per Capita: | $22,903.27 | ||
| Average Salary Per Employee: | $30,309.46 | ||
| Unemployment Rate: | 7.85% | ||
| Consumption: | $5,323,416,676,597.76 | ||
| Exports: | $17,020,946,481,152.00 | ||
| Imports: | $13,471,114,592,256.00 | ||
| Trade Net: | 3,549,831,888,896.00 | ||
| The Sub-Saharan Federation Non Market Statistics ? Evasion, Black Market, Barter & Crime | |||
| Black & Grey Markets Combined: | $414,960,126,297,161.81 | ||
| Avg Annual Criminal's Income / Savings: ? | $117,681.07 | ||
| Recovered Product + Fines & Fees: | $12,448,803,788,914.85 | ||
| Black Market & Non Monetary Trade: | |||
| Guns & Weapons: | $0.00 | ||
| Drugs and Pharmaceuticals: | $22,943,145,382,970.07 | ||
| Extortion & Blackmail: | $45,886,290,765,940.15 | ||
| Counterfeit Goods: | $30,973,246,267,009.60 | ||
| Trafficking & Intl Sales: | $7,456,522,249,465.27 | ||
| Theft & Disappearance: | $18,354,516,306,376.06 | ||
| Counterfeit Currency & Instruments : | $24,090,302,652,118.58 | ||
| Illegal Mining, Logging, and Hunting : | $9,750,836,787,762.28 | ||
| Basic Necessitites : | $25,811,038,555,841.33 | ||
| School Loan Fraud : | $24,663,881,286,692.83 | ||
| Tax Evasion + Barter Trade : | $178,432,854,307,779.56 | ||
| The Sub-Saharan Federation Total Market Statistics ? | |||
| National Currency: | cedi | ||
| Exchange Rates: | 1 cedi = $1.41 | ||
| $1 = 0.71 cedis | |||
| Regional Exchange Rates | |||
| Gross Domestic Product: | $82,589,200,000,000.00 - 17% | ||
| Black & Grey Markets Combined: | $414,960,126,297,161.81 - 83% | ||
| Real Total Economy: | $497,549,326,297,161.81 | ||
| Geopolity Economic Statistics & Links | |||
| Gross Regional Product: | $10,835,977,002,024,960 | ||
| Region Wide Imports: | $1,385,866,224,205,824 | ||
| Largest Regional GDP: | Bluquse | ||
| Largest Regional Importer: | Bluquse | ||
| Regional Search Functions: | All Geopolity Nations. | ||
| Regional Nations by GDP | Regional Trading Leaders | |||
| Regional Exchange Rates | WA Members | |||
| Returns to standard Version: | FAQ | About | About | 483,787,067 uses since September 1, 2011. | |
Version 3.69 HTML4. V 0.7 is HTML1. |
Like our Calculator? Tell your friends for us... |